In the previous post, we read about Bengen’s 1994 study which first brought about the concept of a Safe Withdrawal Rate to ensure one’s portfolio outlasts oneself in retirement.
Close on the heels of Bengen’s publication, came another one: “Retirement Savings: Choosing a Withdrawal Rate That Is Sustainable”, nicknamed the Trinity Study- since the three authors were all professors of finance at Trinity University, Texas.
The original study reviewed data from 1926-1995, pretty similar to what Bengen studied. In 2011 they updated their findings in a followup extending until 2009.
Similar to Bengen’s study, they defined “portfolio success rate” as the percentage of payout periods in the past where the portfolio outlived the retiree.
One significant difference between the studies is that the Trinity Study used High-grade Corporate Bonds for the bond allocation in the portfolio. Bengen, on the other hand, used Intermediate-term Treasuries. Both studies used the returns of the S&P 500 Index to calculate returns on the stock portion of the portfolio.
The Consumer Price Index (CPI-U) was used to determine inflation- since withdrawals were allowed to rise every year by the amount of inflation (inflation-adjusted).
They studied portfolio success rates under the following assumptions:
- Annual withdrawal rates of 3% to 12%
- Rolling payout periods ranging from 15-30 years
- Asset allocations varying from 100% stocks to 100% corporate bonds
- A portfolio is deemed to have failed if it dwindles to zero before the pre-determined payout period is up
Portfolio Success: Nominal Withdrawals
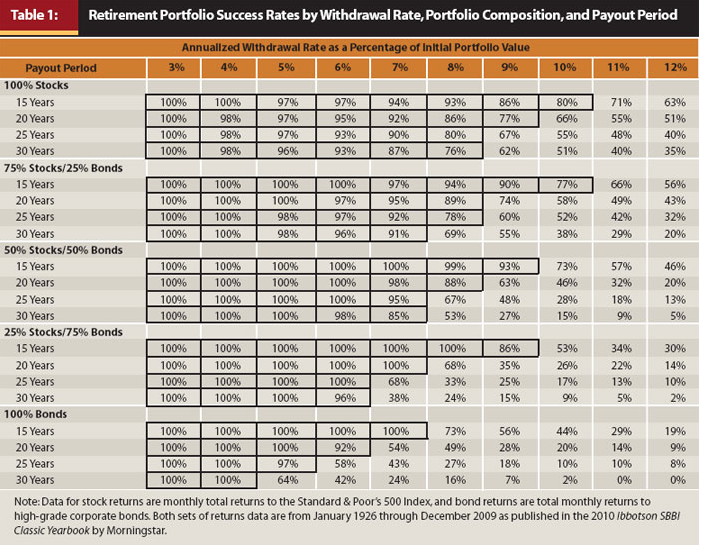
In the following tables, the authors have bordered the results for all portfolio success rates greater than 75%. It is a different discussion whether that is too liberal a cut-off for comfort. I like a 95% or greater chance. This correlates with the threshold for statistical significant (P-value <0.05).

- If withdrawals during retirement are not adjusted for inflation, a high withdrawal rate of up to 6% can be supported for up to 30 years with a high degree of success- greater than 95% most of the time.
- Most of the failures with the high rates occurred for retirements beginning during or right after the Great Depression.
- Portfolios with at least 50% stocks do better than those with less. This finding was shared by Bengen’s study.
- Not increasing annual withdrawals to keep up with inflation over a time period as long as retirement is likely to erode quality of life significantly as time goes by. Hence, this part of the analysis is less relevant for retirement planning.
The meat of the matter comes in the next section.
Portfolio Success: Inflation-Adjusted Withdrawals

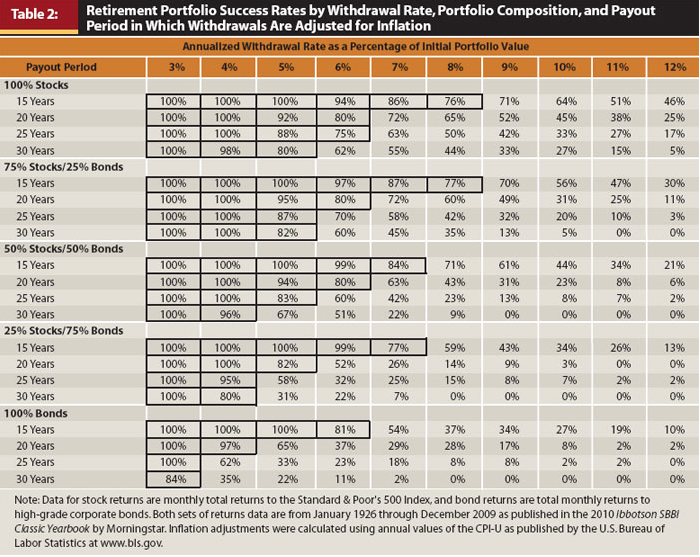
Most retirees would like to maintain a constant “real” income from their portfolio, by adjusting it, usually up, as time goes on. This, however, decreases how much they can withdraw early in retirement- as is evident from the fewer boxes checked in the above table. Let’s see some of the numbers:
- Perusing this table tells us that it is safer to not exceed 4% annual withdrawal rate if we want a greater than 95% chance of having our retirement stash last till the end.
- As with nominal withdrawals, portfolios containing at least 50% stock do better. An all-bond portfolio does not work except for very low withdrawal rates.
- Most of the failures with higher-end withdrawal rates happened during the Stagflation of 1970’s: a period of economic stagnation (and poor market returns) couple with high inflation.
The Importance of Asset Allocation
A higher Stocks:Bonds ratio in the retirement portfolio was found to perform better:
- Portfolios with at least 50% stocks lasted longer more often. A 75-100% bond portfolio lasted 30 years only at a low withdrawal rate of 3%.
- Apart from portfolio longevity, another beneficial effect of a higher stock allocation is the terminal portfolio value. How much money you are likely to have remaining at the end of retirement.

At a 4% withdrawal rate, and a prudent 50/50 Stocks/Bonds ratio, the median portfolio ends up with nearly three times as much as they began with.
Go up further on the equity allocation, and you may have six (for 75% stocks) to ten (for 100% stocks) times your nest egg value! That is some serious potential for good.
So, if one can stomach the volatility from an increased stock allocation, it pays to do that.
Adaptive Withdrawal Plans
The authors reiterate that this and similar analysis is best used as planning tools rather than rigid written-in-stone dictum.
They argue against several adaptive withdrawal plans that have been touted in recent literature. How withdrawal rates can go up and down, within a range, throughout the retirement period, depending on current portfolio value. It introduces needless complexity.
One can definitely change course somewhere down the line, if circumstances and goals change. For instance, if there are only 15 or less years that the retiree expects to need to get by and markets have been generous, AND leaving the maximum possible inheritance for heirs is not a primary objective, she/he can increase withdrawals to 6-7%, provided they have at least 50% in stocks.
During periods of severe market declines, such as the Great Recession of 2008-2009, the ability to decrease withdrawals to just the amount of income from the portfolio, keeps the principal untouched and lets you not have to liquidate assets at a loss.
That’s the Trinity Study, in a nutshell. Knowing where these “rules” come from gives us more insight. And therefore the ability to tweak things appropriate for our goals and circumstances.
Thank you for reading! Please let me know what you think here in the comments.


